Calculates the alpha taxonomic diversity, specifically species richness,
for each cell in a SpatRaster object containing species presence-absence data.
This function provides a straightforward method to sum the number of species present
in each grid cell.
Arguments
- bin
A
SpatRasterobject with multiple layers, where each layer represents a species and cell values are binary (0 for absence, 1 for presence). Species names should correspond to layer names (e.g.,names(bin)).- cores
A positive integer (default is 1). If
cores > 1, a parallel processing cluster is created using theparallelpackage to speed up calculations across raster cells.- filename
Character string. Optional path and filename to save the resulting
SpatRaster. Supported formats are those recognized byterra::writeRaster(e.g., ".tif", ".grd"). If provided, theSpatRasterwill be saved to this file.
Value
A SpatRaster object with a single layer named "Richness". Each cell in this
SpatRaster contains the calculated species richness (number of species present).
The output SpatRaster will have the same dimensions, resolution, and CRS as the input bin.
Details
This function calculates species richness by summing the presence (value 1) of all
species across layers for each individual raster cell. It is an alternative
to spat.alpha() when only Taxonomic Diversity (TD) is required, offering
a more direct and potentially faster computation for this specific metric.
NA values in input cells are ignored during the sum calculation.
Examples
library(terra)
# Load an example SpatRaster with binary presence-absence data
bin_rast <- terra::rast(system.file("extdata", "ref.tif", package = "divraster"))
# Calculate species richness (alpha taxonomic diversity)
richness_map <- spat.alpha2(bin_rast)
richness_map
#> class : SpatRaster
#> size : 8, 8, 1 (nrow, ncol, nlyr)
#> resolution : 0.125, 0.125 (x, y)
#> extent : 0, 1, 0, 1 (xmin, xmax, ymin, ymax)
#> coord. ref. : lon/lat WGS 84 (EPSG:4326)
#> source(s) : memory
#> name : Richness
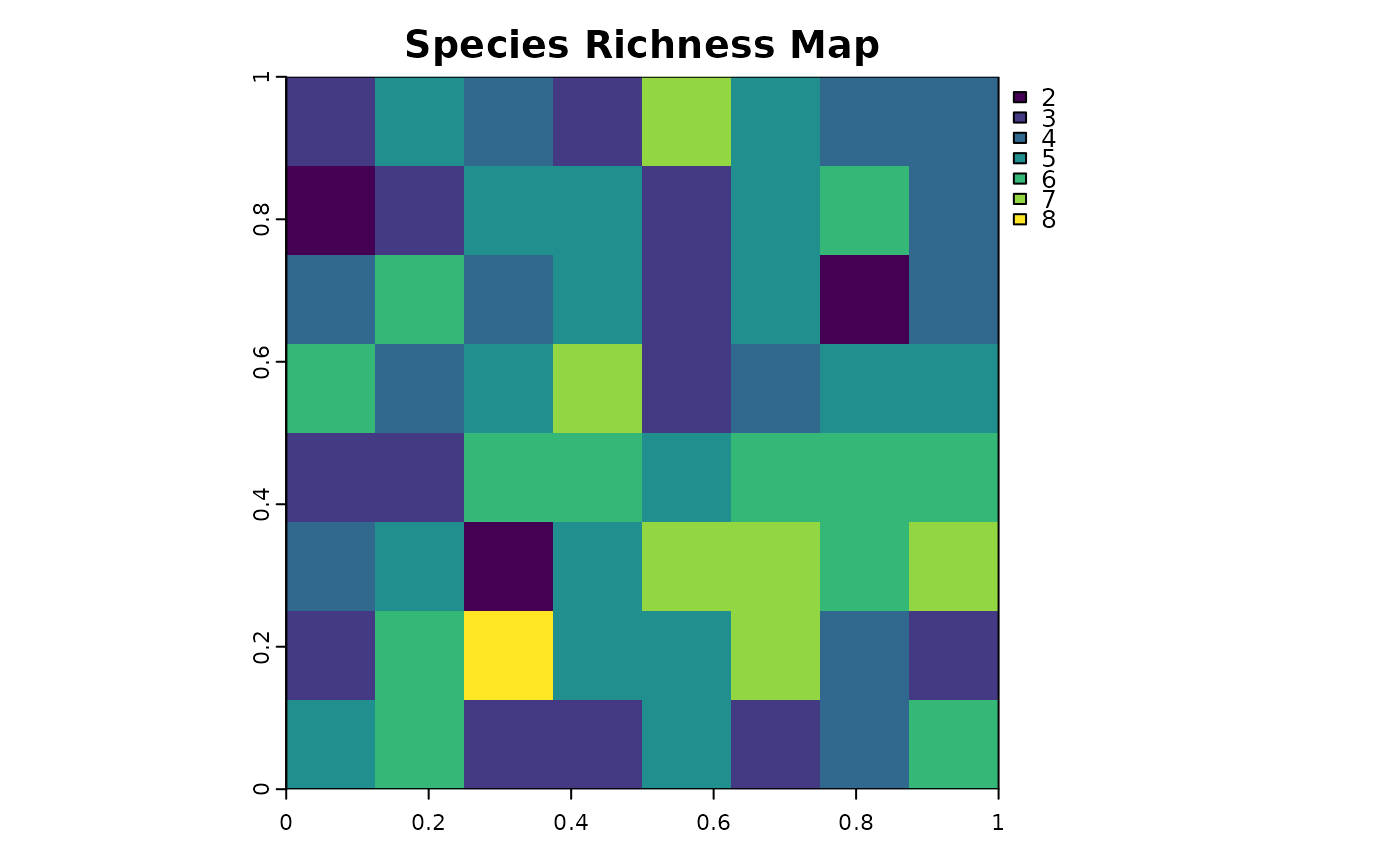
#> min value : 2
#> max value : 8
# Plot the resulting richness map
plot(richness_map, main = "Species Richness Map")